
Member Tools
These tools and more are available in Web Member Services, the PSRS/PEERS online, self-service membership information portal. Click the links below if you already have a Web Member Services account or register to activate your account.
Tools for Active Members
- View Member Statements
- Estimate Service Retirement Benefits
- Calculate a Purchase Cost
- File for Service Retirement Online
- Designate or Update Beneficiaries
Tools for Retirees and Beneficiaries

Retirement Education
We want to help you learn more about your benefits and retirement system. Our counselors are here to help you get all the information you need, and offer a variety of educational opportunities to best fit your busy life.
View PSRS Education Options » View PEERS Education Options »PSRS/PEERS News
PSRS/PEERS Fiscal Year 2013-2014 Investment Return Exceeds Goal, Adds Almost $4.5 Billion in Assets
The Public School and Education Employee Retirement Systems of Missouri's (PSRS/PEERS) strong investment program, paired with substantial returns in the global stock market, resulted in an investment return of 16.9% for the fiscal year ended June 30, 2014. This return is well above the 8% investment return goal set by the PSRS/PEERS Board of Trustees. PSRS/PEERS' market value of invested assets increased through investment earnings by almost $4.5 billion from the previous year.
"Our long-term goal is to provide consistent and meaningful investment returns to support the retirement benefits of our members," says Steve Yoakum, PSRS/PEERS executive director. "Our internal investment staff is committed to managing the Systems' assets in a prudent manner that will ensure the viability of the pension for each Missouri educator. For the second consecutive year, we added significant value above our investment benchmark, which helps maintain consistent contribution rates for all of our members and employers."
The total plan return of 16.9% exceeded both the long-term investment goal (actuarially assumed return) of earning 8%, and the total plan policy benchmark* return of 15.5%. Over long periods of time, PSRS/PEERS also continue to produce investment returns that meet or exceed the Systems' objectives. The annualized investment return for PSRS/PEERS over the last 30 years is 9.9%.
| PSRS/PEERS Investment Return | 16.9% |
|---|---|
| PSRS/PEERS Return Goal | 8.0% |
| Benchmark Return | 15.5% |
For fiscal year 2014, PSRS/PEERS internal investment staff and external investment managers added over $415 million in value above the policy benchmark, net of all fees and expenses.
The actuary for PSRS/PEERS will present a report on the assets and liabilities of the Systems at the October 27, 2014 Board of Trustees meeting. Based on the robust investment returns in fiscal year 2014, it is expected that the pre-funded status of the Systems will increase, indicating the continued strong financial health of PSRS/PEERS. Additionally, the above average investment returns will likely allow the member and employer contribution rates to remain stable for the 2015-2016 school year – the fourth consecutive year of no contribution rate increases.
As we begin fiscal year 2015, we are mindful of the fact that it will become increasingly more difficult to achieve an 8% return in the near term, due in part to historically low interest rates. As a large institutional investor, we believe that we are particularly well suited to navigate upcoming markets given our ability to invest over a 30-year time horizon. The following chart indicates the PSRS/PEERS' asset allocation, which is highly diversified among a number of different investment classes.

The asset allocation is balanced with a significant distribution to return-seeking assets such as stocks and private equity but also a healthy allocation to more defensive investments such as Treasury securities, cash and hedged assets. As the stock market continues to reach new highs, we believe it is prudent to maintain a structured portfolio that has an opportunity to participate if the markets continue to move higher, but also has substantial downside protection in the event of a market correction.
| U.S. Stocks | 25.9% |
|---|---|
| Global Stocks | 21.7% |
| Private Equity | 25.8% |
| Hedged Assets | 15.8% |
| Real Estate | 13.9% |
| Treasuries | 1.9% |
The market value of invested assets for PSRS/PEERS combined were approximately $37.9 billion on June 30, 2014, making the joint entity larger than all other public retirement plans in Missouri combined, and the 44th largest defined benefit pension plan in the United States. For more PSRS/PEERS investment news, visit the investment section of this website.
*The plan policy benchmark is a standard to measure investment performance and indicates the return of the PSRS/PEERS asset allocation if passive market rates of return were achieved.
PSRS/PEERS Fiscal Year 2013-2014 Investment Return Exceeds Goal, Adds Almost $4.5 Billion in Assets
The Public School and Education Employee Retirement Systems of Missouri's (PSRS/PEERS) strong investment program, paired with substantial returns in the global stock market, resulted in an investment return of 16.9% for the fiscal year ended June 30, 2014. This return is well above the 8% investment return goal set by the PSRS/PEERS Board of Trustees. PSRS/PEERS' market value of invested assets increased through investment earnings by almost $4.5 billion from the previous year.
"Our long-term goal is to provide consistent and meaningful investment returns to support the retirement benefits of our members," says Steve Yoakum, PSRS/PEERS executive director. "Our internal investment staff is committed to managing the Systems' assets in a prudent manner that will ensure the viability of the pension for each Missouri educator. For the second consecutive year, we added significant value above our investment benchmark, which helps maintain consistent contribution rates for all of our members and employers."
The total plan return of 16.9% exceeded both the long-term investment goal (actuarially assumed return) of earning 8%, and the total plan policy benchmark* return of 15.5%. Over long periods of time, PSRS/PEERS also continue to produce investment returns that meet or exceed the Systems' objectives. The annualized investment return for PSRS/PEERS over the last 30 years is 9.9%.
| PSRS/PEERS Investment Return | 16.9% |
|---|---|
| PSRS/PEERS Return Goal | 8.0% |
| Benchmark Return | 15.5% |
For fiscal year 2014, PSRS/PEERS internal investment staff and external investment managers added over $415 million in value above the policy benchmark, net of all fees and expenses.
The actuary for PSRS/PEERS will present a report on the assets and liabilities of the Systems at the October 27, 2014 Board of Trustees meeting. Based on the robust investment returns in fiscal year 2014, it is expected that the pre-funded status of the Systems will increase, indicating the continued strong financial health of PSRS/PEERS. Additionally, the above average investment returns will likely allow the member and employer contribution rates to remain stable for the 2015-2016 school year – the fourth consecutive year of no contribution rate increases.
As we begin fiscal year 2015, we are mindful of the fact that it will become increasingly more difficult to achieve an 8% return in the near term, due in part to historically low interest rates. As a large institutional investor, we believe that we are particularly well suited to navigate upcoming markets given our ability to invest over a 30-year time horizon. The following chart indicates the PSRS/PEERS' asset allocation, which is highly diversified among a number of different investment classes.
The asset allocation is balanced with a significant distribution to return-seeking assets such as stocks and private equity but also a healthy allocation to more defensive investments such as Treasury securities, cash and hedged assets. As the stock market continues to reach new highs, we believe it is prudent to maintain a structured portfolio that has an opportunity to participate if the markets continue to move higher, but also has substantial downside protection in the event of a market correction.
| U.S. Stocks | 25.9% |
|---|---|
| Global Stocks | 21.7% |
| Private Equity | 25.8% |
| Hedged Assets | 15.8% |
| Real Estate | 13.9% |
| Treasuries | 1.9% |
The market value of invested assets for PSRS/PEERS combined were approximately $37.9 billion on June 30, 2014, making the joint entity larger than all other public retirement plans in Missouri combined, and the 44th largest defined benefit pension plan in the United States. For more PSRS/PEERS investment news, visit the investment section of this website.
*The plan policy benchmark is a standard to measure investment performance and indicates the return of the PSRS/PEERS asset allocation if passive market rates of return were achieved.

Tune in to stay informed about your retirement system, gain valuable insights, and hear from experts on how to make the most of your benefits. Join us for engaging discussions and essential updates designed with your needs in mind.
Life Events
When life brings changes your way, it can also impact your PSRS/PEERS membership. Click below for more information.
A New Member

Welcome! Your membership gives you distinct advantages when working toward a financially secure retirement. Get off to the right start and register for access to Web Member Services today.
Newly Married

If you are recently married, it can impact your beneficiary designations.
A New Parent

Birth or adoption of a child requires you to update your beneficiary designations.
Recently Divorced

If you named your spouse as a beneficiary, divorce means you may need to update your beneficiary designations. Some divorced retirees may also have options for benefit increases, or "pop-ups."
Moving

Keep your contact information up-to-date so we can communicate with you about your membership and ensure benefits are paid according to your wishes.
Ready to Retire

Apply for service retirement online using Web Member Services, or using paper forms found on this website.
Leaving Your Job

You have options when temporarily or permanently leaving covered employment.
A Working Retiree

It is important to understand post-retirement work limits and how they may impact your benefit payments.
Benefits by County

As of June 30, 2025, approximately 113,000 individuals received benefits from PSRS/PEERS. Total annual benefits paid was nearly $4.0 billion. Of this amount, over $3.5 billion, or 88%, was distributed among Missouri's 114 counties, positively impacting the state's economy.
PSRS/PEERS Quick Facts
A summary of PSRS/PEERS statistics as of June 30, 2024.
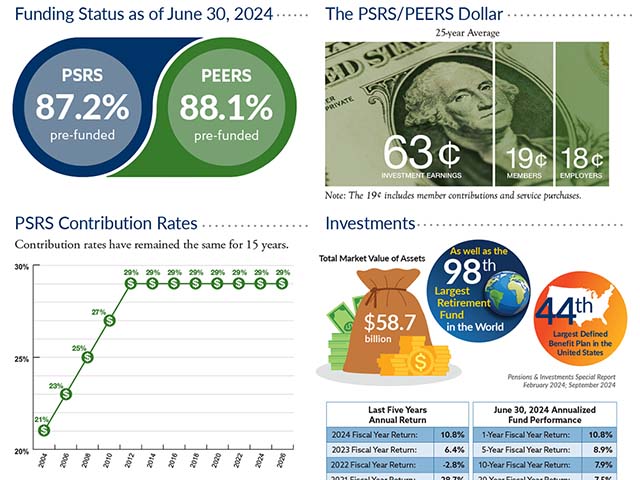
PSRS/PEERS Funding
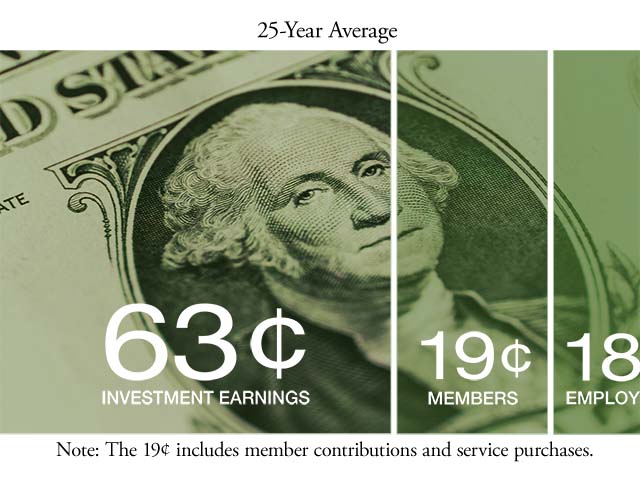
PSRS/PEERS' funding comes from three sources, member contributions, employer contributions and investment earnings. Investment earnings are the primary source of funding for every dollar of PSRS/PEERS benefits paid.